
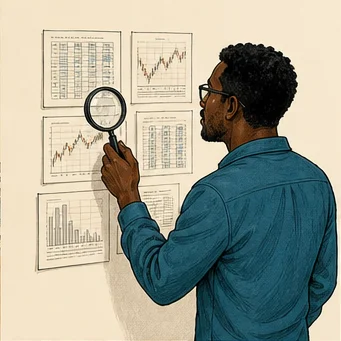
A backtest functions as a research record rather than a guarantee that a specific strategy will clear an evaluation. Historical price charts cannot automatically replicate the nuances of spread fluctuations, missed order fills, strict platform rules, or the psychological pressure a trader feels during a fast session. When you rely solely on synthetic results, you risk ignoring the gap between theoretical gains and actual account outcomes.
Honest testing requires you to ask how an idea fails as well as how it wins. This mindset matters significantly in challenge settings because strict drawdown limits can disqualify a strategy long before its long-run statistical average has time to emerge. By prioritizing realism over idealized performance, you build a foundation that respects the realities of capital management, execution friction, and the unforgiving nature of simulated firm environments.
Readers building a complete challenge plan can pair this review of prop firm challenge backtest manipulation: how to test a strategy honestly with the prop firm passing service guide, which compares the wider support process and its limits.
What a Backtest Can and Cannot Prove
A backtest serves as a documented history of how explicit logic behaved when applied to a specific dataset. It cannot establish future performance, prove the long-term reliability of data, or demonstrate rule compliance unless specific criteria are met. You must clearly define the costs, account rules, selection choices, and precise date ranges for the results to hold any objective value. Without these, the numbers are just a snapshot in time.
A truly credible report allows another person to view the assumptions and potentially challenge them. If your results rely on hidden data or undisclosed discretionary choices, categorize them as speculative research rather than concrete proof. Transparency acts as the filter that separates a viable strategy from a collection of lucky guesses. Always assume that if you cannot explain the mechanism behind a result, you do not truly own that result.
Consider an illustrative scenario where a trader uses an automated trend-following system on a 5-year data set. If the system earns 20% annually but excludes the spread costs associated with a volatile 2022 market period, the result is misleading. The test proves the logic works in a vacuum but fails to prove it can withstand actual liquidity constraints. A useful test identifies the exact moment the logic breaks down.
When evaluating backtested data, you must distinguish between the logic and the environment. The logic involves your entry and exit rules, while the environment consists of the broker and platform constraints. Even a perfect set of rules can fail in a live evaluation if the execution engine does not align with the firm's data feed. You are building a test to survive the firm's unique constraints, not to win a hypothetical contest.
Identifying Red Flags in Challenge Backtests
Be naturally skeptical of smooth equity curves that show no losing periods, entries filled at prices that never existed, or results displayed only as cropped screenshots. These visual presentations often hide the messy reality of trading. If you notice a complete absence of losing streaks in a 12-month sample, ask whether the parameters were chosen specifically to fit that same period. Data snooping is the primary cause of inflated expectations in finance.
Inspect individual trades specifically around volatile events and losing streaks, rather than just looking at the final summary chart. Manipulation often appears in the entry assumptions, the omission of standard trading costs, or a start date selected because it happens to look profitable. If the strategy only performs well during one specific season, it is not a robust system. Look for consistency across both high-volatility and low-volatility regimes.
Consider a hypothetical case where an equity curve shows a perfectly straight line upward. Upon closer inspection, you find the strategy entered every single long position at the absolute daily low. This is a classic example of an unrealistic entry assumption. Markets rarely provide perfect fills, and relying on them in your model creates a false sense of security. Real results should show a mix of winning and losing trades.
Another warning sign is a lack of parameter history. If a developer claims they tested 50 variations but only shows the best one, they are likely curve-fitting. A robust model should be stable across a wide range of input values. If changing a stop-loss by 5 ticks turns a profitable strategy into a disaster, your model is too fragile. Always look for broad stability instead of narrow, hyper-optimized perfection in your results.
- Absence of raw trade logs for independent verification
- Entries executed at impossible, off-market prices
- Omission of critical drawdown periods during market stress
- Results limited to a small, cherry-picked date range
- Lack of documentation about parameter selection
Adding Realistic Execution Costs
You must deduct spread, commission, swap, and a conservative slippage assumption from every relevant trade in your testing. A system that shows a small average gain per trade often disappears once a delayed fill or a wider spread is applied. Many traders underestimate the impact of these small daily costs. Over 100 trades, an extra 2 ticks of slippage can turn a small winner into a persistent loss.
Use worse-than-average assumptions in a stress version of your test, particularly for stops and market orders. The goal is to learn whether your account survives imperfect conditions, not to preserve a preferred result. When you stress test, apply the widest spread you have seen on your platform. If the system still remains profitable under these harsher assumptions, it is far more likely to survive a real evaluation period.
Consider an illustrative example where a strategy trades a liquid futures contract. You might model a 1-tick commission per side and a 1-tick slippage cost for market entries. If your model produces a net return of $500, but your stress test with 3-tick slippage drops that to negative $200, you have identified a clear vulnerability. You must decide if your execution speed can reliably keep slippage near 1 tick.
Do not ignore the impact of swaps or holding fees for overnight positions. If your strategy keeps positions open past the daily reset, ensure your backtest account reflects these costs. Firms often charge significantly more than standard retail brokers for overnight risk. Failing to account for these costs in your model can lead to a surprise when your account balance declines faster than your calculations suggested during the testing phase.

Testing the Drawdown Model
Recalculate your equity curve using the firm's daily and overall loss definitions, including open loss where applicable. You must track the intraday worst point, not just the closing balance, because that is where breaches occur. A closing balance might look safe, but an intraday spike could have triggered an immediate failure. You must model the path to the finish line, not just the final outcome of each day.
Run your calculation trade by trade in the firm’s specific time zone, including any simultaneous positions. A strategy can have an acceptable closing drawdown while still exceeding an intraday equity threshold during the middle of a session. If you only track daily results, you will overlook the most common cause of failure. Always test against the most restrictive version of the firm’s drawdown rules to ensure maximum safety.
Think of a hypothetical account with a $5,000 total loss limit. Your strategy might show a closing balance of $4,800, which looks fine. However, during the day, a sudden market move might have pushed the temporary account value to a $5,100 loss before recovering. Because the firm checks this limit in real time, that momentary drop ends your challenge. Your test must capture every such peak and valley.
Pay attention to how the firm handles open trade equity in their drawdown calculations. Some firms include the gain or loss of currently open trades when they check your breach threshold. If your model only looks at realized profits and losses, you are missing half the risk. Always check the official rules of the evaluation and mirror that logic in your own internal spreadsheet or backtesting software.
Using Walk-Forward and Stress Tests
Reserve a portion of your data that was never used to choose your settings. Then, test nearby parameter values and simulate adverse execution to see how the logic holds up. A robust idea should not depend on one exact stop, session, or year to be profitable. If your success disappears the moment you shift your parameters by a few percent, the model is likely too sensitive to be useful in a live environment.
Do not keep retuning your settings until the reserved period looks attractive. This process turns your test period into a fitting exercise rather than a validation exercise. Log every change you make and evaluate it on later, unseen data. If the performance degrades on new data, you must discard the changes. Keep the process strict and disciplined to avoid fooling yourself with results that only work in the past.
For an illustrative example, imagine you test a moving average crossover on data from 2020 through 2022. You find the best length is 14 days. If you then apply this 14-day setting to 2023 data and it loses money, the 14-day setting was likely just a result of random luck in the first sample. A robust system would have performed acceptably across all years. If the test fails in the future period, you must go back to the drawing board.
Walk-forward analysis provides a clearer picture of how a strategy adapts to new information. By breaking your data into segments, you ensure that you are never testing on the same data you used to find the entry logic. This is the gold standard for independent research. It prevents the bias that occurs when you look at the entire chart before setting your rules. Focus on out-of-sample results for your final decision.

Related guide for Prop Firm Challenge Backtest Manipulation: How to Test a Strategy Honestly: A useful companion for this decision is Prop Firm EA and Copy Trading Compliance: What Traders Must Check. Automation and copying can improve consistency, but they can also violate a program's terms. Review the platform, execution, and account rules before using either.
Accounting for Manual Execution
If a human must interpret the signal, you must test the real workflow: alerts, decision delay, platform navigation, and even skipped trades. A rule that requires a perfect reaction at a major news release is not a practical manual plan. Humans introduce latency and error that automated tests simply cannot see. If you are not an expert at clicking buttons under pressure, your strategy must be forgiving enough to allow for small human delays.
Compare the theoretical entry with the price a person could actually obtain after receiving an alert and checking the current risk. If that gap is material, you must incorporate it into your rules and results. Do not assume you will always get the best price. In reality, you will often get a slightly worse price than what the historical data suggests. Update your expected outcomes to reflect these human realities so you are never caught off guard.
Imagine a hypothetical scenario where your strategy triggers an alert on a fast-moving trend. You might need 3 seconds to verify the trend and confirm your position size. In those 3 seconds, the price may have moved 10 ticks against you. If you calculate your performance based on the price when the alert fired instead of the price when you actually clicked the buy button, your backtest is flawed. Always record your entry at the price you actually paid.
Include a safety margin for human error in your plan. If your strategy has a specific entry setup, track how many times you missed the trade entirely because you were too slow. If you miss 20% of your trades, that statistic must be part of your performance record. Knowing your actual capability allows you to adjust your risk management accordingly. A strategy that assumes you are a robot will eventually fail when you act like a human.
How to Assess Passing-Service Claims
Ask any provider for the full methodology behind their claimed results. This includes the account rules, the date range, the total number of attempts, the risk per trade, and whether the activity was actually permitted under firm terms. A success rate presented without a denominator and a clear record of failure is not actionable evidence. Always dig into the fine print of any performance claim before you take it seriously.
Ask for enough detail to distinguish genuine research from standard marketing, while respecting legitimate privacy boundaries. A provider should be able to explain their risk-per-trade percentage and their maximum allowable drawdown without hesitation. Refusal to discuss risk limits or failed cases should reduce the weight you give their claim. Trust is earned through transparency, and an honest provider will gladly show you the losing months along with the winning ones.
Consider a hypothetical firm marketing a 90% success rate. If they do not disclose that this applies to only 10 accounts out of 1,000, the figure is essentially meaningless. A high success rate in a small, select group does not guarantee your personal success. Always look for records that cover a broad range of traders and varied market conditions. If the data seems too good to be true, it likely is, especially when context is missing.
Be aware that different evaluation firms have different rules about data feeds, execution platforms, and prohibited trading styles. A strategy that passes a test on one platform may be ineligible for a payout at another firm. When evaluating a service, make sure their requirements align with your strategy's strengths. Do not force a square peg into a round hole by trying to adapt your strategy to a firm that is fundamentally incompatible with your trading style.

A Strategy Testing Checklist
Do not let a strategy influence a paid account until its assumptions are written down and stress-tested. Keep the raw trades and all settings saved so a later result can be audited instead of explained with hindsight. If you cannot produce a file that shows exactly how you made a profit, you cannot learn from it. Keeping a detailed log is the only way to turn your experience into a consistent, repeatable business process.
Repeat this checklist after any strategy change, platform update, or when moving to a new account type. Small changes in symbol specifications or execution can invalidate assumptions that previously looked reasonable. Even a change in the server's location or the way the platform handles stop orders can introduce enough latency to break a sensitive strategy. Treat every change as a new opportunity to verify that your logic still holds up under current conditions.
For your audit trail, maintain a folder for each strategy iteration. In this folder, store your code or logic rules, your raw input data, your execution assumptions, and your full results log. If you ever have a losing streak, you can look back at this folder to see if the market has fundamentally changed or if your original assumptions were simply too optimistic. This builds your knowledge base over time and makes you a much stronger trader.
Finally, ensure your testing environment mirrors the live account environment as closely as possible. If you use a different data provider for your test than the one you use for the challenge, your results will be unreliable. Use the same symbols, the same platform, and the same rules. Consistency in your testing infrastructure is the best way to ensure that your practice sessions actually translate into success in the real evaluation.
Scaling Strategy Risk
Most strategies perform differently when you increase contract sizes or position numbers. A system that works with 1 contract might fail when you try to scale to 5 contracts because of order depth. You must model how your execution affects the market price. If your position size exceeds standard retail order depth, your own trades will move the market against you. This phenomenon is known as slippage caused by size. Ignoring it leads to massive errors in your projections.
Consider a hypothetical case where you test a system that enters 100 contracts at once. If the average volume at the bid is only 50 contracts, your order will consume the available liquidity. The remaining 50 contracts will be filled at worse prices. A simple backtest often assumes all 100 contracts fill at the same price. This creates a massive gap between your test and the actual outcome. Your test must account for this depth limitation.
To test this properly, you must look at market depth data during your backtest periods. You need to verify if the average volume at the best bid or offer could support your largest trade size. If the volume is too low, you must cap your position size or build a model that handles multi-level fills. Many traders fail evaluations because they increase size too early and hit execution limits. Always scale your size slowly during testing to see if the market can absorb your entries.
Think of a scenario where you grow your account size by 20% every month. Your risk per trade grows with your balance. If your strategy has a high win rate, it might handle this change well. If it has a high variance, the larger size might trigger a drawdown breach that you did not anticipate. Always stress test your strategy with scaling rules applied. This ensures you can scale safely without violating the strict limits of your firm.
A final detail to consider is the cost of holding larger positions. Some firms have different margin requirements for larger accounts. If your strategy relies on holding many positions, your margin usage might climb quickly. Use your test to calculate the peak margin usage per day. If you reach 80% of your available margin often, you are living too close to the edge. A small market move could force a liquidating event or a violation.

Related guide for Prop Firm Challenge Backtest Manipulation: How to Test a Strategy Honestly: For the next practical part of your preparation, continue with Why Prop Firm Traders Fail Challenges and How to Build a Better Process. Most challenge failures are preventable process failures. This guide breaks down the patterns that repeatedly end evaluations and the habits that replace them.
Modeling Market News Events
Major economic news causes volatility that makes most automated strategies fail. Spreads widen instantly and price movement becomes erratic. If your strategy does not specifically handle news events, you must exclude these time periods from your trading plan. Relying on an automated stop loss during a news spike is dangerous. You might get filled at a price far worse than the one your platform shows.
Consider a hypothetical example where your strategy trades a major currency pair during a monthly jobs report. Your stop loss is set at 10 ticks from your entry. The market jumps 30 ticks in one second. Your stop is triggered at the new market price, which is 20 ticks beyond your limit. This is called a stop loss gap. A simple backtest might assume you were filled at your stop price. In reality, you suffered a much larger loss.
To model this reality, you should mark all major news event times on your historical data. Filter these periods out of your test results first. If your strategy is not designed for news, the data from these periods is mostly noise that will bias your results. If you choose to trade through the news, you must add a high penalty to your slippage for those time blocks. Assume that you will never get a good fill during a news release.
Look for the impact of news on your drawdown metrics. A single news event can account for 50% of your total historical losses. If your strategy holds through these periods, it is likely overly dependent on luck. A robust strategy often sits on the sidelines until the volatility settles. If your test shows that your best gains only come during quiet, non-news periods, you must include a hard rule to stop trading before announcements.
Document the specific news releases that caused the largest drawdowns in your test. Use this list to build a manual exclusion filter. You will find that your account stability improves significantly when you stop fighting the market during major releases. This does not mean you have to stop trading for the whole day. It just means you should manage your risk before the event happens. Being proactive is better than being reactive.
Accounting for Technical Execution Frictions
Trading platforms and data feeds introduce their own set of frictions. Latency between your computer and the exchange server can cost you crucial ticks. If your strategy uses a fast momentum trigger, you need to know how much time it takes for your order to reach the firm. Even a 50 millisecond delay can change the outcome of a trade. If you do not know your latency, you are flying blind.
Consider a hypothetical situation where your system monitors 4 different market indicators at once. Your computer takes 100 milliseconds to calculate the final signal. By the time your order is sent, the market price has changed. You might be missing the best entry every time. In a backtest, the system assumes you see the signal the instant it appears. This is a common trap that leads to inflated performance claims.
To fix this, you should perform a ping test to the trading server during the same time of day you trade. Use that number as a delay factor in your backtest software if possible. If your software does not allow for a delay factor, add a flat cost of 0.5 ticks to every entry to compensate. This conservative approach will give you a much more realistic view of what you can actually achieve. Do not assume perfect zero-latency execution.
Platform stability is another factor that is often overlooked. Sometimes the platform freezes or the data feed hangs during high volume periods. If your strategy relies on an active connection, you might end up with an open position that you cannot close. Your backup plan should be to close positions via the firm's web portal or mobile app. Practice this process until you can do it in under 30 seconds. A frozen platform is a common cause of unexpected breaches.
Check how your platform handles stop-limit orders versus market orders. Many firms prefer market orders for speed but they expose you to more slippage. Stop-limit orders might provide better price protection but they carry the risk of not getting filled at all. Your test should show the impact of both order types on your bottom line. Choose the one that aligns with your risk tolerance and account size. Consistency is the goal.

Simulating Psychological Stress Limits
Your mental state during a losing streak is the hidden variable that ruins many careers. A backtest is cold and logical, but you are not. When you lose 3 days in a row, you will feel the urge to change your strategy. This change is often the exact wrong thing to do. You must use your testing data to build a set of rules that keep you from sabotaging yourself during hard times.
Think of a hypothetical case where your strategy has a maximum historical losing streak of 6 trades. If you hit trade 4 and start to panic, you might close the trade early or increase your size to win it back. Both actions are based on emotion. If your records show that the 5th and 6th trades in a streak are often winners, you can use that data to stay calm. Your test is your objective proof that you should stick to the plan.
Establish a daily loss limit that is strictly for your own mental health, even if the firm's limit is higher. If you know that you start making bad decisions after losing 2% in one day, set your limit to 1.5%. This creates a buffer that keeps you within your comfort zone. Your backtest can help you see how often you would have hit that self-imposed limit. This helps you understand the frequency of your forced breaks.
Create a checklist for what to do after a bad trade. Your first step should be to look at your original trade thesis. Ask if the entry logic was followed correctly, regardless of the outcome. If it was, the trade was a success of process even if it was a loss of capital. If you did not follow the plan, you have a clear area for improvement. Keeping this focus keeps you from blaming the market or the platform for your mistakes.
Use your backtest records to perform a post-mortem on every major drawdown. Identify exactly why the losses happened. Were they due to a change in market regime, or were they just part of the normal statistical variance? If it was just variance, accept the loss as the cost of doing business. If the strategy has broken, you must be honest about that. A clear-headed view is the only way to maintain the discipline needed for long-term success.
Final Takeaway
The primary purpose of a backtest is to reduce self-deception, not to create an attractive equity curve. Transparent, conservative assumptions are far more useful than impressive but unreproducible output. You are not trying to impress anyone with your history; you are trying to ensure your future account can survive the harsh constraints of a firm evaluation. When your results are transparent, you gain the confidence needed to follow the plan when the market moves against you.
If a strategy only survives under ideal fills or a narrow parameter choice, treat it as evidence to revise the idea or decline the challenge rather than taking more risk. Trading is about managing the probability of failure as much as it is about finding profit. If your testing reveals that a strategy is fragile, you have succeeded in identifying a risk before it cost you your capital. Use this knowledge to refine your approach until it is robust enough to handle the reality of the market.