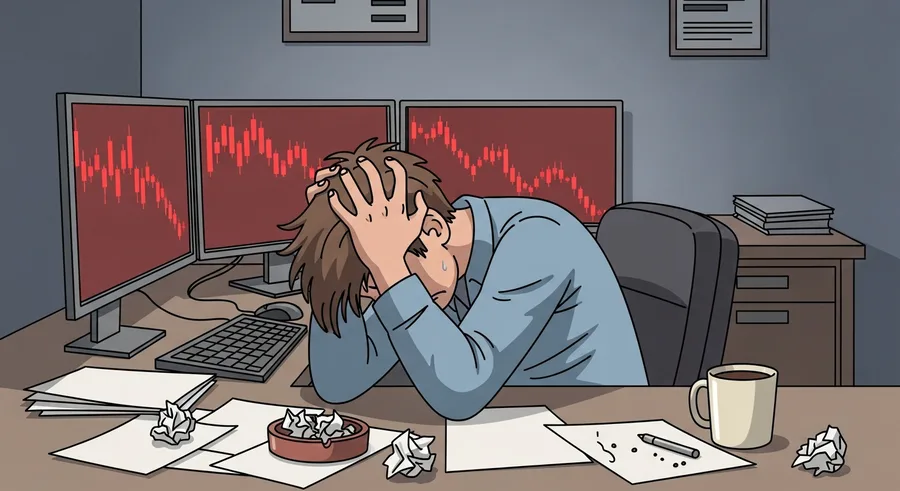

A challenge journal is not a diary of wins and losses. It is an evidence file showing whether the process used on each trade matched the rules, the setup definition, and the risk budget. When you undertake a firm evaluation, your goal is to demonstrate consistent adherence to specific constraints.
Keep it fast enough to complete while details are fresh. A few structured fields, a chart image, and a short post-trade note are more useful than a long narrative written after the result is forgotten. You need a system that builds a clear picture of your trading habits without adding hours of paperwork to your daily routine.
This article covers one part of the decision. The main prop firm passing service guide explains how how to use a trading journal to pass a prop firm challenge connects with preparation, risk control, and the funded stage.
The Purpose of a Challenge Journal
A journal preserves facts that memory edits after a win or loss. Its job is to show whether an order followed the setup, risk plan, and account rules. When you face a loss, it is easy to rationalize the decision. A journal forces you to look at the hard data.
Use the record to separate a valid losing trade from an avoidable mistake. That distinction tells you whether to keep testing a method or repair behavior. If a trade fits your plan but results in a loss, you have performed your job well. If a trade violates a rule, the fault lies in your execution process.
Consider a hypothetical case. You enter a position based on a technical breakout. The market reverses and hits your stop. If your journal shows the entry was at the right level, at the right time, and within your risk limits, the loss is merely a statistical reality. If the journal shows you ignored a news event, that is a mistake.
Your journal acts as an objective observer. It provides the proof you need to refine your approach. By focusing on process over outcome, you stop chasing results and start managing your business. This mental shift is necessary for any trader aiming for long-term viability within a firm structure.
The Minimum Fields to Record
Record date, server time, instrument, direction, entry, stop, quantity, planned dollar risk, exit, and result. Add the setup name and the rule conditions that applied. These data points provide the skeleton of your trading activity. Without them, you are guessing at what works.
Capture these fields at entry and exit so they are not reconstructed from memory. Consistent labels make filtering by session or setup possible later. When you can filter your data, you can isolate variables. You might find that your setup works well in the morning but fails consistently in the afternoon hours.
Using consistent labels is important for clarity. If you record your setup as breakout in one trade and breakout signal in another, your data becomes messy. Choose your terms and stick with them. A clean spreadsheet allows you to spot trends that you would otherwise miss during a manual review.
- Use server time to align with firm data.
- Record planned and actual risk for every position.
- Name the setup clearly to allow for future filtering.
- Log the specific instrument and time of day for each entry.
Use Screenshots and Markups
A marked chart can reveal late entry, moved stop, nearby levels, and event timing that a number-only record hides. Take it before entry and after exit when possible. Visual cues tell a story that numbers cannot. You see exactly where you entered relative to the candles and moving averages.
Annotate only the decision-relevant facts: trigger, stop, target, and reason for exit. Too much decoration makes later review slower. You want to see the setup clearly at a glance. Focus on the entry and the trade management. Keep it clean and simple for the most efficient review process possible.
Imagine you look back at a losing trade. The numbers suggest the trade was fine. However, a screenshot reveals you entered five minutes after the trigger because you were hesitant. This visual evidence of hesitation is the key to identifying a psychological hurdle that requires your immediate attention and focus.
Use screen capture software that allows for quick annotations. Save your charts in a folder named by date. This keeps your records organized and easy to access during your weekend analysis session. Never skip this step, as visual evidence is often the most revealing part of your daily record keeping.

Add a Rule-Compliance Log
Add a compliance field for news windows, holding restrictions, daily-loss status, and any automation or copying rule. A profitable trade can still be important if it was noncompliant. Firm rules are rigid. If you breach them, you put your status at risk regardless of your profit performance.
Use yes, no, or unclear rather than vague notes. Resolve every unclear label with the firm before repeating that activity. Being proactive about rules prevents catastrophic errors. If you are ever uncertain about a trade, seek clarity immediately. Never trade on an assumption when it comes to firm policy.
Consider an illustrative failure case. You are in a challenge that prohibits trading during major economic news. You take a trade three minutes before a headline release because your chart setup looks perfect. Even if you make money, you have violated a firm rule. This is a critical error to log.
By tracking compliance, you turn your journal into a risk management tool. You start to see if you have a blind spot for certain rules. If you find yourself frequently hitting unclear status, you are failing to understand your own parameters. Tighten your procedures to ensure you stay within the firm guidelines.
Record the Emotional Context
Emotional notes become useful when attached to a behavior. Frustrated matters when it led to an early re-entry, an increased size, or a moved stop. Your goal is to map your feelings to your actions. You will likely see patterns where certain emotions lead to specific rule-breaking behaviors.
Use a short scale and one sentence about the action taken. The goal is to find repeatable triggers, not to judge the feeling. If you feel bored and start trading setups that are not in your plan, log it. Boredom is a dangerous emotion in this profession because it breeds over-trading.
Hypothetically, you feel anxious about a losing streak. You decide to double your size to make the money back. This is a classic emotional trap. By documenting the feeling of anxiety alongside the decision to size up, you create a clear warning system for your future self.
Do not overthink this. You are not a therapist. You are a trader looking for data. If you felt confident or nervous, write it down alongside the trade details. Over time, you will see which emotions correlate with your best days and which ones precede your worst mistakes.
Run a Weekly Review
Weekly review looks for patterns across enough trades to matter. Filter results by setup, session, size, instrument, and mistake type before deciding what to change. A single trade is noise. A month of data is a signal. The weekly review helps you bridge the gap between those two states.
Start with the largest preventable cost, such as entries during restricted windows or trades beyond the daily plan. Keep one improvement for the next week. Do not try to fix everything at once. Focus is key. If you improve one small area each week, your performance will compound significantly over time.
Take a look at your session breakdown. Are you performing better in the first 2 hours of the day? If your data shows that most of your profitable trades occur during the market open, consider stopping your activity after the initial session. This is a simple adjustment based on concrete evidence.
Review your mistakes again. Did you move your stop in any of the losing trades? If so, why? Ask yourself if the decision made sense at the time or if it was a reaction to fear. Use this knowledge to refine your rules for the coming week to prevent similar actions.
- Group comparable trades to find setup performance trends.
- Find preventable losses by reviewing rule adherence records.
- Set one clear experiment for the next week of trading.
- Calculate the average dollar loss per failed setup.

Related guide for How to Use a Trading Journal to Pass a Prop Firm Challenge: A useful companion for this decision is Prop Firm Trading Psychology: Stay Clear Under Evaluation Pressure. Challenge rules turn normal trading variance into a psychological test. These routines help you protect attention, avoid revenge trading, and make the next decision objectively.
Share the Right Evidence With Support
If you share a journal with support, remove anything unnecessary and agree on its purpose. Useful feedback should identify rule, sizing, or execution patterns from the evidence. You are looking for a professional review of your process, not a conversation about your feelings. Keep it focused on the firm's requirements.
Do not let a journal become a channel for pressure to trade more. You should receive explanations and retain control of the plan and account access. If you find that interactions with support make you feel rushed or insecure, re-evaluate how much information you are sharing. You are the one in charge.
Your journal is your private research. Only share summaries that directly relate to rule compliance or technical questions. If you ask a question about your trade, include the specific entry, exit, and setup context. This saves time for both you and the support team and leads to much more helpful answers.
Be wary of advice that encourages you to deviate from your proven strategy. Your goal is to pass the challenge by following your rules, not by chasing what a support person might think is a better play. Use support as a tool for rule clarification, not for strategic guidance.
A Simple Journal Template
Use one repeatable row per trade: date, setup, market context, entry, stop, size, planned risk, exit, rule status, screenshot, and lesson. Add a separate daily summary. Keep the format static so you can easily compare rows. Spreadsheets are excellent for this type of record keeping because they are easily filterable.
A template is successful when it takes minutes rather than becoming a second job. Review it each week and remove fields that never inform a decision. If you find a column you never use for analysis, delete it. Your goal is to capture the minimum viable data for maximum actionable insight.
Consider a hypothetical row. On September 5, you trade a support bounce. Your entry is 100.25, stop is 99.80, and size is 500 shares. Your risk is $225. You exit at 100.75 for a gain. Your status is compliant. You add a note that the trade reached the target quickly.
This level of detail is perfect. It gives you the full story without wasting your time. When you aggregate this data into a monthly report, you can easily see your win rate and average trade length. You can also calculate your total risk taken versus the actual reward achieved.
Managing Your Mental State
A lot of traders struggle with the pressure of a challenge. You feel like you have to prove yourself. That pressure often forces bad decisions. Use your journal to capture those moments where pressure starts to influence your process. If you feel forced to take a trade, write it down immediately.
Sometimes the best trade is the one you do not take. If you have a day where you do not see your setup, note that in your daily summary. That shows discipline. A good journal proves that you know how to wait for the right opportunities, which is a sign of maturity.
Consider the cost of a bad trade. Beyond the money, you spend energy and focus. Every unnecessary trade drains your capacity for the next day. If your journal shows you are taking 10 trades when your plan calls for 3, you have a clear behavioral issue to address with your next plan.
Do not be afraid of seeing negative patterns. They are not failures. They are simply parts of your process that need adjustment. You cannot fix what you do not see. By recording your struggle, you begin the process of moving past it and becoming a more resilient trader over time.
Deepening Your Analysis
Once you have a month of data, go deeper. Do not just look at your win/loss ratio. Look at the time of day. Are you losing more at 1 PM? That is a common time for markets to consolidate. If your system requires volatility, you might be forcing trades when the market is asleep.
Look at your stops. Are you getting stopped out by a tiny margin before the trade moves in your direction? That might mean your stop distance is too tight for the current volatility. This is a technical adjustment you can make to your rules. It is an objective, data-driven improvement.
Think about your instrument choice. Are you trading things you do not fully understand? Maybe you should narrow your focus to one or two instruments where your setup works best. Your journal will show you which instruments are helping your account and which ones are just burning your capital away.
Every data point is an opportunity to learn. The more you interrogate your data, the more secrets you will uncover about your own style. You will find that some of your assumptions about trading were wrong, and that is a great thing to discover. It means you are growing.
Building the Journaling Habit
Journaling should be part of your trading workflow. Treat it like pre-market setup. You would not enter a trade without checking your charts, so do not enter a trade without having your journal open. Make it a non-negotiable part of your day, just like your breathing or your desk setup.
If you find you are skipping your journal, make it easier. Use a simple tool that opens on your second monitor automatically. If it takes too many clicks, you will stop doing it. Keep it fast. The easier it is, the more likely you are to maintain the practice for the long haul.
Try keeping a physical notepad next to your keyboard if you are distracted by digital tools. Jot down the core trade info right as you enter. Then, update your digital log at the end of the day. This dual approach ensures you never forget the details of an active trade.
You are building a habit of excellence. Every entry you make in that journal is a signal that you are a serious professional. It sets you apart from those who just gamble and hope for the best. Consistent effort is the foundation of all lasting success in this competitive industry.

Related guide for How to Use a Trading Journal to Pass a Prop Firm Challenge: For the next practical part of your preparation, continue with How to Continue After a Loss and Still Pass a Prop Firm Challenge. Losses are part of trading. The key is responding without turning one normal result into a rule breach or a revenge-trading sequence.
Staying Within Firm Boundaries
The primary challenge is to stay within the rules. Your journal is your shield against accidental violations. Every time you think about taking a trade, cross-reference it with the firm's requirements. If there is even a small doubt, skip the trade. It is never worth the risk of losing your evaluation status.
Use your journal to track your progress toward the evaluation target. You can see how close you are to your goal and what it will take to get there safely. This prevents you from making a massive, reckless bet to finish the challenge. Always trade for consistent, steady progress.
If you encounter a confusing situation about a firm rule, log the specific incident in your journal. Note the time and the exact circumstances. This prepares you for a clear, fact-based conversation with support. It shows you are not just whining, but actually trying to understand and adhere to the guidelines.
Remember that the challenge is just the first step. The habits you build during this process will follow you into a funded account. If you cut corners now, you will keep cutting them later. Build a rock-solid process today. Your future self will appreciate the discipline you are demonstrating right now.
Mapping Risk and Position Sizing Constraints
Prop firm challenges often enforce strict drawdown limits that dictate your maximum allowed position size. Advanced traders use their journals to map how different position sizes correlate with their emotional stability and adherence to stop-loss placement. Hypothetical example 1: If your account has a $5,000 limit, you might track how taking a full 2% risk per trade changes your behavior compared to taking 0.5% risk. You likely find that smaller risk sizes keep you calmer and prevent the urge to move stops prematurely.
Record the exact percentage of your account capital allocated to each trade. Compare this to the volatility of the asset being traded. If you trade 1000 shares of a low-volatility stock versus 100 shares of a high-volatility futures contract, the actual dollar risk might be identical but the psychological weight differs. Your journal must capture this nuance to help you identify which instrument classes best suit your risk tolerance and your specific profit targets.
Integrate a field for the distance to your stop-loss in relation to the current average true range of the instrument. This helps identify if you are being stopped out by standard market noise or by a genuine reversal of the trend. Hypothetical example 2: A trader notes that 80% of their losses occur when the stop is placed within 1 point of the entry. By adjusting the stop to 1.5 points of the entry in the journal, they can test if the win rate increases sufficiently to offset the larger individual risk taken per trade.
Include a column to log the maximum adverse excursion for every trade, regardless of whether it ended in a win or loss. This metric reveals how much heat you are comfortable with before the trade works in your favor. If you find your winning trades regularly drawdown $50 before moving into profit, you learn to wait for the dip rather than entering prematurely. This prevents panic-selling winning setups that simply needed more room to breathe.
Analyze the correlation between position size and time-of-day. Certain market phases require smaller sizes due to liquidity gaps or wider spreads. Use your journal to establish a hard rule for position scaling based on time. If your data shows that 3 PM trading consistently produces losses regardless of size, you have a strong evidence-based reason to stop trading at that time entirely.
Using Quantitative Metrics for Objective Self-Assessment
Shift your focus from absolute dollar gains to performance metrics that indicate long-term consistency. Calculate your profit factor by dividing total gross profits by total gross losses. A ratio above 1.5 usually indicates a sustainable approach. If your journal reveals a profit factor near 1.0, you are break-even and must identify the single largest source of loss. Reducing that loss source is often more effective than trying to increase your win rate.
Track the average duration of your trades to define your personal trading style. Hypothetical example 3: You classify yourself as a day trader, but your journal shows that your average trade lasts 4 hours. This suggests you are actually holding positions across session changes, which might violate firm rules against overnight holdings. Identifying this pattern allows you to align your actual behavior with the rules you agreed to follow.
Calculate the expected value of your setups by multiplying your probability of success by your average win size, then subtracting the product of your probability of failure and your average loss size. This calculation provides the math behind your strategy. If the result is negative, your setup is not a statistical edge. You must either tighten your entry criteria or widen your profit targets to make the math work in your favor.
Segment your performance data by trade type to isolate your strongest setups. Use a simple spreadsheet formula to calculate the win rate and average gain for specific patterns like breakout, pullback, or mean reversion. You will likely discover that one pattern contributes 70% of your profits while another merely adds friction and cost. Drop the weaker pattern to simplify your focus and improve your overall bottom line.
Monitor your consistency through the lens of trade frequency. Many traders sabotage their progress by over-trading when bored. Compare your daily trade count against your equity curve. If you see your biggest drawdowns occur on days with the highest number of trades, you have identified a clear behavioral trigger. Use your journal to set a daily maximum trade limit and record every time you are tempted to break that limit.

Stress Testing Strategies via Journaled Simulations
Treat your journal as a laboratory for stress testing your strategy against extreme market conditions. During periods of low volatility, log how your setups perform. When high-impact news releases arrive, observe how your entries would have performed had you taken them. Hypothetical example 4: You log a hypothetical entry during a non-farm payroll release. The price moves 50 points in 2 seconds. By documenting this, you recognize that your standard stop-loss would have been bypassed by slippage, potentially leading to a catastrophic account violation.
Use the journal to document your reaction to technical failures like platform freezing, internet outages, or order entry errors. These events are inevitable. By recording exactly how you handled the situation, you create a contingency manual. Note the time it took to resolve the issue and the impact it had on your open positions. This reduces the panic factor when the next technical problem inevitably strikes.
Perform a retrospective audit of trades you skipped. If your criteria were met but you felt too fearful to pull the trigger, log the missed opportunity as a missed signal. Analyze why you were afraid. Was it a previous loss? Was the market moving too fast? Understanding the cause of your hesitation helps you build a checklist that removes the fear by creating a definitive rule for when to enter and when to stand aside.
Conduct a quarterly audit of your journal to ensure your strategy has not degraded due to market regime shifts. Markets change from ranging to trending cycles. A strategy that worked well last quarter might be failing now. By reviewing your trade outcomes over 3 months, you can see if your edge is shrinking. This allows you to pivot your setup definitions before you hit your drawdown limits.
Simulate the impact of commission and slippage by subtracting these costs from your total profit in your journal. Many traders ignore these hidden costs until they realize they have eaten up their gains. By logging the exact fill prices and comparing them to the mid-market price at the time of entry, you develop a realistic view of your trading profitability that keeps your expectations grounded.
Recognizing and Neutralizing Psychological Biases
Cognitive biases heavily influence trading results. Use your journal to detect patterns like loss aversion, where you hold losers too long hoping for a turnaround, or the disposition effect, where you exit winners too early. Hypothetical example 5: You notice in your journal that you consistently exit winners when they hit $50 of profit, even when the chart setup indicates much more room to run. By labeling this as a bias, you can start to force yourself to hold for the target once, twice, and then repeatedly.
Log the state of your environment before you sit down to trade. Are you tired, stressed, or distracted? Research shows that trading performance correlates strongly with mental state. If you find your win rate drops 20% on days you slept less than 6 hours, you have an objective reason to prioritize rest as part of your professional routine. This turns lifestyle management into a data-backed business requirement.
Document instances of confirmation bias. This happens when you seek out market analysis that supports your existing position while ignoring contrary signals. If you are long an asset, you might look only for bullish news. Write down one bearish argument for every trade you take. This forces you to acknowledge the risks and prevents the blind optimism that often leads to holding losing positions past the point of recovery.
Analyze the phenomenon of revenge trading by logging the emotional trigger immediately after a loss. If you felt angry and immediately re-entered, record the exact thought that led to the decision. Seeing the cycle written out helps you break it. Often, simply writing down the frustration is enough to vent the emotion and stop the urge to trade before it manifests as a sequence of ill-advised orders.
Cultivate a mindset of detachment by focusing on the process of writing rather than the content of the outcome. The journal acts as a mirror, showing you the reality of your behavior without judgment. Accept the flaws you see as data points. By treating every mistake as a lesson, you strip the emotional sting from your losses and replace it with a focus on refining your edge for the next session.
Final Takeaway
At week end, group trades by setup, session, instrument, risk size, and rule status. Look for a repeatable behavior such as entries after a news window or losses concentrated after the second trade, rather than blaming the largest loss alone. This methodical approach turns your raw data into actionable wisdom.
The journal should lead to one concrete experiment for the next week, such as one fewer trade per session or a smaller first risk unit. Preserve prior entries so the change can be judged against evidence. Your growth relies on this cycle of action, measurement, and adjustment. Stay the course and let the data guide your path toward consistent and reliable results.